After looking at last quarter's survey results, I started to get concerned about the validity of our high "customer satisfaction score". Although our responses have been rather consistent, the drop in satisfaction rate between Q3 2008 and Q1 2009 got me a little worried--mainly because it was a 4% drop. I started to re-examine the data and it appears as though there are many factors that should be considered when looking at the “drop” in “satisfaction”.
The first flag was what appears to be a drop in survey participation over the past few quarters. During the first installment of the survey we had 30,272 respondents. That number has dropped by nearly 50%, with 15,823 respondents in Q4 of 2008 and 15,682 respondents in Q1 2009.
Here are a few possible explanations for this “apparent” drop in participation over time:
1) The novelty of the first survey encouraged more participation.
-Even though we have 100 million people seeing the “What’s New” page with every update and we only allowed the survey to appear to 10% of that population, there is a self-selecting bias in any opt-in survey.
-The further we move away from Firefox 3 launch, the lower the enthusiasm for the product. I'm not saying that people have stopped loving Firefox 3, I'm just saying that the further we get away from the launch, the less likely people are to be willing to take a survey to tell us they love the product. (Its’ awesomeness, in essence, has become the status quo).
2) The first survey was released with 3.02 and 3.03 (released a day later), which may have inadvertently increased the number of people who saw the survey link, and consequently, may have artificially doubled our participation with the survey’s first release.
I think option #2 is really the only one that makes sense in this context. It’s easy to see how (self-selecting) individuals would have taken the survey twice and thus inflated our initial “customer satisfaction score”. And since the past two surveys have been consistent in participation and responses, I think that it may be worth completely throwing out the data from the first survey.
Other concerns about the survey came from looking at the responses to certain questions.
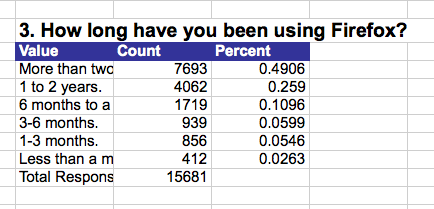
For example: "How long have you been using Firefox?"
Another red flag was the number of people who started but did not complete the third installment of the survey. The survey released in December ’08 had a total of 37 “abandoned” surveys. The most recent installment of the survey was “abandoned” 5419 times. Why the huge jump in abandonment rate? I think it comes down to two changes we made to the survey:
1) We increased the number of questions from 8 to 10.
2) We reformatted the survey so that the questions were split equally on two pages.
I think both of these changes, though well intentioned, really took us away from our main goal of this program—to create a simple, short survey that would efficiently allow us to get a better picture of all of our customers.
To review, here are the takeaways:
1) Q32008 Results and “Satisfaction Score” are probably inflated and should be disregarded.
2) The surveys tend to be taken mostly by long-term, loyal Firefox users. We need to find a way to get responses from a more diverse cross-section of Firefox users.
3) We need to pay attention to the design of our survey to ensure we don’t scare users off with the number of questions/layout of the survey.
So, what next? I think our next steps are to step back and try and get a better understanding of what the data we have collected in the past nine months *really* means. That also means trying to figure out what we have previously called our "Customer Satisfaction Score" is really measuring. Is it a customer loyalty score? Is it an enthusiasm score? At this point, I'm not really sure, mainly because I don't know the extent of the biases in our data.
It would be great to hear your thoughts and suggestions: what can we do differently? How do we get a better sample of all types of Firefox users? How can we try to minimize bias?
Stay tuned!
6 comments:
Nice work and thanks!
Running
Adidas currently manufactures several running shoesNike shoes, including the adiStar Control 5, the adiStar Ride
Cheap nike shoes
Discount nike shoes
the Supernova Sequence and the Supernova Cushion 7, among others.
Nike shox r4
nike shox shoes
Adidas also uses kangaroo leather to make their more expensive shoes.
Association football
One of the main focuses of Adidas is football kit and associated equipment.
puma cat
cheap sport shoes
Adidas also provides apparel and equipment for all teams in Major League Soccer. Adidas remain a major company in the supply of team kits for international football teams.
cheap nike shox
cheap nike max
Adidas also makes referee kits that are used in international competition and by many countries and leagues in the world. In the United States, referees wear the Adidas kits in MLS matches even though the primary referee supplier is Official Sports.
nike tn dollar
nike running shoes
The company has been an innovator in the area of footwear for the sport with notable examples including development of the Copa Mondial moulded boot on firm dry pitches for forty years.
nike air max tn
puma shoes
Adidas became renowned for advancing the "Predator" boot design.This design featured a ribbed rubber structure for the upper leather of the shoe, used to accent the movement of the ball.
discount puma shoes
puma mens shoes
The Predator also features the Craig Johnston invented "Traxion" sole. As the development and popularity of Football continued Adidas played a leading role in shaping the style of the play itself.
puma running shoes
puma shoes
FIFA, the sports governing body, commissioned specially designed footballs for use in its own World Cup tournaments to favour more attacking play.
ghd hair straighteners mk4
hair straightners
ghd iv styler hair straightener
ghd hair straightners
cheap ghd hair straighteners
Hi… that was great stuff.. I really like this subject. Could you tell me more … I would love to explore.
Organic vitamins
Nice energy and vibe you put out there. You have so much to offer, I like the energy and the nice values you apply to your site. Real interesting and outstanding point of view.
affordable search engine optimization services
Thanks for your marvelous posting! I actually enjoyed reading it, you will be a great author.
CCTV Systems
CCTV Monitors
I really wanted to say thanks for this kind of post and I highly recommended it, thanks again for sharing such a wonderful post! Planes Wallpapers | Sports Wallpapers | Travel & World Wallpapers | Vectors & Designs Wallpapers
Post a Comment