Here's a quick overview of the survey:
This survey was released on the 23rd of September and was available to 10% of FF3 updaters of both 3.02 and 3.03 in 10 locales, including: Japan, China, France, UK, Spain, Italy, Brazil, Poland, Germany and the United States. The basic goal of this survey was to create a standard the Marketing Team can use to periodically measure our users' awareness, usage habits and attitude towards the Firefox, a goal that I think we achieved.
Below you will find the six questions and some analysis. Others in the Marketing Team will also post some of their opinions, and in a future post, I will do more analysis of the responses to these questions by locale.
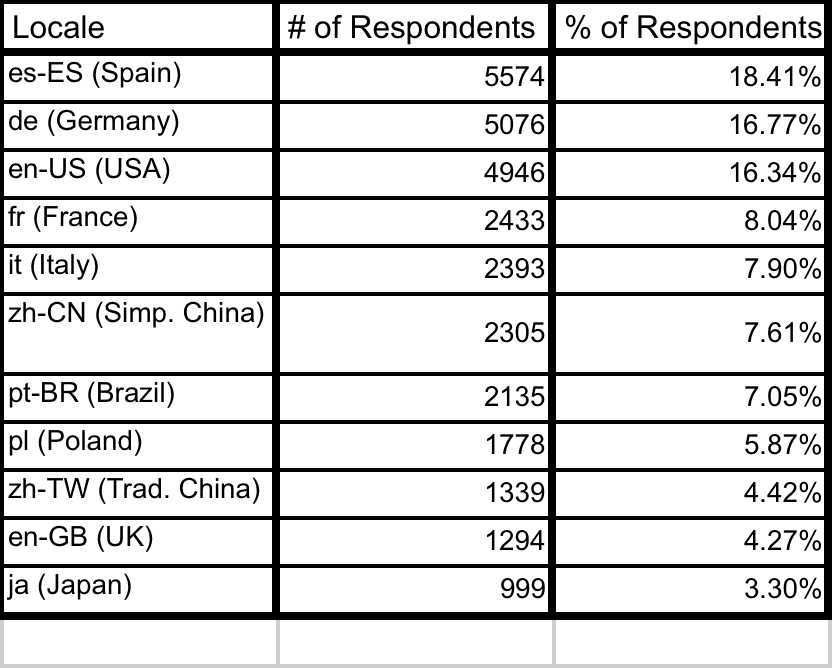
To begin, the six question survey was completed by 30, 272 people (the results are statistically significant)--a much higher number of responses than anyone expected. The distribution of respondents is here:
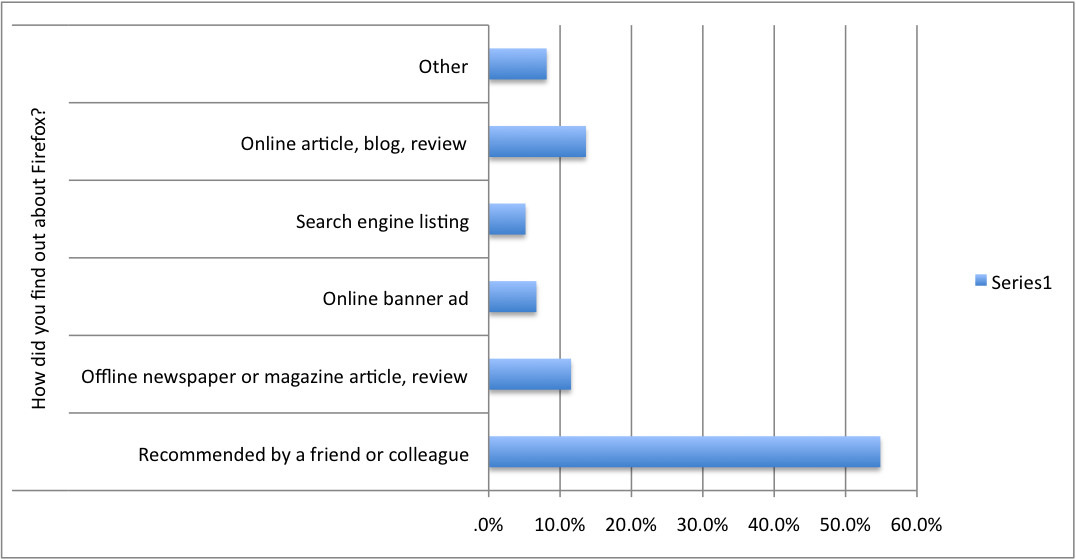
1. How did you find out about Firefox?:
Recommended by a friend or colleague
Offline newspaper or magazine article, review
Online banner ad
Search engine listing
Online article, blog, review
Other
If "other," please specify. Most popular answers were: "Cant remember how they started using it" or they've been using it for so long, they have no idea", "they've been using it since the beginning".
55% of responders found out about FF3 because of a peer recommendation, a finding that I expected in that I thought most people found out about Mozilla products by word of mouth. I did not expect that such a large majority of people would find out by word of mouth, imagining response rates closer to 40% and the other responses to be more evenly distributed. At the end of the day, seeing that the majority of people learn about Firefox through word of mouth is an excellent sign. For people to make the effort to recommend Firefox to another person means that they believe in our product enough and are satisfied enough to want to share it with others. As long as our satisfaction rates remain high, the rate of people finding out about Firefox from a peer will remain high--they are inextricably tied.
2. What is the primary reason you downloaded Firefox 3.0?:
Security
Customization
Performance
Open source
Recommendation
Other
If "other," please specify. Most popular answers were "Automatic update" or "All of the above".
This first graph shows that overall, performance seems to be the biggest reason people are choosing Firefox. Security, however, is not far behind--results we expected. I did not expect that customization to be so low down on the list, probably because I've always seen the ability to customize as the main difference between Firefox and the rest. At the same time, however, to have performance as the most popular reason people downloaded Firefox means that we're doing a good job--it means our product is doing what it's supposed to do and doing it well.
One reason customization may not have performed so well is that people don't know how to understand the term "customize"--i.e. they don't know that an add-on means customizing their browser. It also may be possible that people just don't know anything about add-ons, but that seems unlikely if you look at the results for question 3. I'll look into this more deeply for the next post.

3. Have you installed an add-on (including themes) to customize Firefox 3.0?:
Yes
No
Unsure
I do not know what an add-on is
The good news about this results to this question is that the majority of our users know what an add-on is and have installed one. At the same time, I think that for +20% of our users to not know what an add-on is seems a bit high. The next question to ask then is why? Is it an awareness issue? Is it an issue with the AMO site? Maybe people don't understand that installing plug-ins is the same thing as installing an add-on?
The next step here is to compare this data to our user profile information to try and figure out how a user's profile may explain this lack of awareness of add-ons--ie the people that don't know what add-ons are the ones who are on the Internet the least.

5. On average, how much time do you spend on the web?:
More than 8 hours per day
Between 5 and 8 hours per day
Between 2 and 5 hours per day
Between 1 and 2 hours per day
Less than 1 hour per day
This graph is pretty self-explanatory and the results are representative of what we expected. Most of our base is made up of moderate to heavy users, although there is a good number of light users. I think that the light internet user segment of the population is where the most of our growth needs to come from in the coming months, but its nice to see a good proportion of them responding to this survey. (see D Bottoms' Comscore data).

6. On a scale of 1-5, with 1 being 'not likely' and 5 being 'most likely', how likely are you to recommend Firefox to a friend?:
This last graph is the one that I think most people will end up thinking about and following the closest. To clarify, we got this result by combing the answers of people who responded with 1, 2 or 3 into the "unlikely" to recommend column and combining the answers of the people who responded with 4 or 5 in the "likely" to recommend column. Taken together, we have an 87% likely to recommend rating which can also be understood as an 87% customer satisfaction rating. This is an incredible number, one that few other products reach. As such, we will continue to monitor this rating and to see how it continues to trend over the coming quarters.
Be on the look-out for more posts in the next few days. I'll be posting a complete pdf version soon.
This survey was released on the 23rd of September and was available to 10% of FF3 updaters of both 3.02 and 3.03 in 10 locales, including: Japan, China, France, UK, Spain, Italy, Brazil, Poland, Germany and the United States. The basic goal of this survey was to create a standard the Marketing Team can use to periodically measure our users' awareness, usage habits and attitude towards the Firefox, a goal that I think we achieved.
Below you will find the six questions and some analysis. Others in the Marketing Team will also post some of their opinions, and in a future post, I will do more analysis of the responses to these questions by locale.
To begin, the six question survey was completed by 30, 272 people (the results are statistically significant)--a much higher number of responses than anyone expected. The distribution of respondents is here:
1. How did you find out about Firefox?:
Recommended by a friend or colleague
Offline newspaper or magazine article, review
Online banner ad
Search engine listing
Online article, blog, review
Other
If "other," please specify. Most popular answers were: "Cant remember how they started using it" or they've been using it for so long, they have no idea", "they've been using it since the beginning".
55% of responders found out about FF3 because of a peer recommendation, a finding that I expected in that I thought most people found out about Mozilla products by word of mouth. I did not expect that such a large majority of people would find out by word of mouth, imagining response rates closer to 40% and the other responses to be more evenly distributed. At the end of the day, seeing that the majority of people learn about Firefox through word of mouth is an excellent sign. For people to make the effort to recommend Firefox to another person means that they believe in our product enough and are satisfied enough to want to share it with others. As long as our satisfaction rates remain high, the rate of people finding out about Firefox from a peer will remain high--they are inextricably tied.
2. What is the primary reason you downloaded Firefox 3.0?:
Security
Customization
Performance
Open source
Recommendation
Other
If "other," please specify. Most popular answers were "Automatic update" or "All of the above".
This first graph shows that overall, performance seems to be the biggest reason people are choosing Firefox. Security, however, is not far behind--results we expected. I did not expect that customization to be so low down on the list, probably because I've always seen the ability to customize as the main difference between Firefox and the rest. At the same time, however, to have performance as the most popular reason people downloaded Firefox means that we're doing a good job--it means our product is doing what it's supposed to do and doing it well.
One reason customization may not have performed so well is that people don't know how to understand the term "customize"--i.e. they don't know that an add-on means customizing their browser. It also may be possible that people just don't know anything about add-ons, but that seems unlikely if you look at the results for question 3. I'll look into this more deeply for the next post.

3. Have you installed an add-on (including themes) to customize Firefox 3.0?:
Yes
No
Unsure
I do not know what an add-on is
The good news about this results to this question is that the majority of our users know what an add-on is and have installed one. At the same time, I think that for +20% of our users to not know what an add-on is seems a bit high. The next question to ask then is why? Is it an awareness issue? Is it an issue with the AMO site? Maybe people don't understand that installing plug-ins is the same thing as installing an add-on?
The next step here is to compare this data to our user profile information to try and figure out how a user's profile may explain this lack of awareness of add-ons--ie the people that don't know what add-ons are the ones who are on the Internet the least.

5. On average, how much time do you spend on the web?:
More than 8 hours per day
Between 5 and 8 hours per day
Between 2 and 5 hours per day
Between 1 and 2 hours per day
Less than 1 hour per day
This graph is pretty self-explanatory and the results are representative of what we expected. Most of our base is made up of moderate to heavy users, although there is a good number of light users. I think that the light internet user segment of the population is where the most of our growth needs to come from in the coming months, but its nice to see a good proportion of them responding to this survey. (see D Bottoms' Comscore data).

6. On a scale of 1-5, with 1 being 'not likely' and 5 being 'most likely', how likely are you to recommend Firefox to a friend?:
This last graph is the one that I think most people will end up thinking about and following the closest. To clarify, we got this result by combing the answers of people who responded with 1, 2 or 3 into the "unlikely" to recommend column and combining the answers of the people who responded with 4 or 5 in the "likely" to recommend column. Taken together, we have an 87% likely to recommend rating which can also be understood as an 87% customer satisfaction rating. This is an incredible number, one that few other products reach. As such, we will continue to monitor this rating and to see how it continues to trend over the coming quarters.
Be on the look-out for more posts in the next few days. I'll be posting a complete pdf version soon.
102 comments:
I enjoyed your post. I have been wondering about this topic...
Video AC Milan|Video Sepak Bola|How To Make a Kite|How to make a origami|Tips for lossing weight|How to six pack abs
I thought I would leave my first comment. I don't know what to say except that I have enjoyed reading. Nice Share free tutorial | Blog dofollow | Ilmu komputer | PayPal WishList | Sistem Pakar | Twilight Express | Spy camera shop | Simcool | Casablanka | Tutorial seo | Sistem Pakar | Twilight Express | Pakar Seo | Express Entrepreneurship | Sahabat Sejati | Domain Murah | Blog Lerry | Download pc media | Fans club artis | disnak bengkulu | disnak | Hosting murah
Great post! I’m searching for this information for long time and I have found it here. Kontes Seo Kerja keras adalah energi kita Pertamina | Tutorial seo
Great article to read.. :)
Thanks for sharing,,
Very nice statistics. this is pretty interesting information.
Hendrik
generic cialis
The Marketing team is excited to announce the first release of the Firefox Quarterly Customer Survey The survey,Costa rica tourswhich will be released on the 23rd, will appear on the "What's New" page of Firefox 3.0.2 and Firefox 2.0.17 and will be available in ten locales.
http://www.kingtours.com
I love your marketing information. Thank you very much for sharing it with us. Keep up a good work.
buy generic cialis
güncel blog
online porno izle porno izle hallederik.org
The Marketing Team is New Zealand's first out-sourced marketing department, staffed solely by experienced marketing and brand managers.Costa rica toursMarketing Team ensures that people in Fedora can consistently explain to everyone what Fedora is, why the project can.
http://www.kingtours.com
I think this blog is pretty cool,it has a lot of good and interesting content about results for the Q3,good for you I hope you can add more useful information and upgrade your site,I really like it Costa Rica Cheap Land for Sale
lots in costa rica
Don't know what is wrong what is rite but i know that every one has there own point of view and same goes to this one..
Aluminum fence
Ornamental aluminum fence
Hey,
Loving your blog, awesome tips on this you have here. I
would just like to ask you some questions privately, mind
contacting me at sales@ company logo design.com
Hey,
Loving your blog, awesome tips on this you have here. I
would just like to ask you some questions privately, mind
contacting me at ,info@seo services
Thanks,
Mark
seo company
hi its seems like you have done a hard work on it. I have got lots of information from your post. Really appreciate your work.!! It was describe very nicely keep us doing good work..
Best Buy USA
Best buy Store
Discount electronics
I read through the report and it was a great source of information. Thanks for providing the great read!
cheap turntables
corded phonesA
2 line Corded Phones
This is a very informative article.I was looking for these things and here I found it. I am doing a project wireless weather station and this information is very useful me. If you are interested, but this is my duty to inform you that virtual administrative assistant a very dedicated service and can be applied anywhere you want and get better results.
weather station
weather stations
thx to admin sms valentine, sms valentine, contoh sms valentine, puisi valentine
Thanks ever so much, very useful article.
Leather Biker Jacket
You may have not intended to do so, but I think you have managed to express the state of mind that a lot of people are in. The sense of wanting to help, but not knowing how or where, is something a lot of us are going through...
Free eBook Download Daily News World pdf download Restaurant Recipes Buying Car Guide Recipe For Chicken resep masakan ebook gratis Daily News Update Gadget Review New Mobilephone
Great article. Your articles are a pleasure to read and very helpfull indeed. Thank you wallpaper lucu model baju batik superbowl sunday
A perfect info source for souvenirs from Vienna Thanks for taking the time to discuss this, I feel strongly about it and love learning more on this topic - Weight Loss Best Exercises - Weight Loss Best Exercise - Weight Loss Best Exercises For Men - Weight Loss Best Exercises For Women
I do agree with all the ideas you have presented in your post. They’re very convincing and will definitely work. Still, the posts are very short for starters. Could you please extend them a bit from next time? Thanks for the post. buy renova
That is exactly how I come across the firefox. So many of my friends has been using it that I had to check it out. refinance mortgage
great post.. i love your content. and i love my camcorder canon hv40 like a pro..and now i'm movie makker..canon vixia hv40
great post.. and i love my camcorder from canon. that is canon hv40thanks dude..
totally cool
much more creative than the HOLLYWOOD one
I’d really like to see this design wincompany logo design _ | _ logo design
Hello, your blog is really good, I like it very much!By the way, if you like nike shoes you can come here to have a look!
Three icons converge in Nike Shoes Us, a bold design that combines the best style and cushioning features from legends of Nike Air Max Shoes. With the lacing system of the '95, "Nike air max 2011the silhouette of the '97, and the full-length Max Air inspired by the Nike Air Max 2009, this shoe delivers unbeatable comfort 24 hours a day, seven days a week.
Nike Air Max 1
Air Max Griffey 1
Nike Air Max 180
Nike Air Max 2009
Nike Air Max 2010
Nike Air Max 24 7
Nike Air Max 87
Nike Air Max 2011
Nike Air Max 91
Nike Air Max BW
Nike Air Max Plus TN
Nike Air Max LTD
Nike Air Max Boots
Nike Air Max Presto
Nike Air Max Skyline
Nike Air Max Turbulence
Nike Air Max Fitsole
Nike Air Max Goadome
Nike Air Max Zenyth
Nike Air Max Wildwood Supreme
Nike Air Max Zoom Kobe
Nike Air Max Shoes.
The Louboutin Shoes Sale is planned using the ladies. offered the fact that pumps was born, the ladies lifestyle turn into colorful. The christian Louboutin 2011 Pumps
will be the god's masterwork. Who invited the Christian Louboutin Wedges ? Seldom people knew, but I think each and every and every lady will be grateful for him. between the countless pumps,the Christian Louboutin Shoes
could be probably the most exceptional ones. The stylish pattern, the delicate design all mold the ladies perfect leg profile. Flowers inside the spring of 2011 creeping, up from frizzy hair to outfits hold on to footwear, have experienced a brilliant up. on this type of the glamor, spring and summer time flowers now here. Romance is really a woman's mood, exquisite flowers just appropriate of expression within our gestures, the woman, how can we not adore the romantic temperament to make certain which they distributed the flowers do? 2011 flowers bloom will get satisfaction from numerous poses! The Christian Louboutin New Sandalsalso can adds the hright in the ladies, it hold shock toward short lady. especially the red-colored lone in the louboutin heels, beauty and sexy, different ladies are crazy. The red-colored sole, the earliest attribute in the Sale Louboutin stroe.
I just switched over to firefox from google chrome...I love it!
Christian Louboutin heels http://www.christian-louboutin-heels.us is commonly a European shoe. Artist who promoted his collection of luxury women's christian louboutin evening http://www.christian-louboutin-heels.us/c-christian-louboutin-evening.html in earlier 90s. No 1 can disregard the existence in the style world, World-famous christian louboutin pumps http://www.christian-louboutin-heels.us/c-christian-louboutin-pumps.html and christian louboutin peep toe http://www.christian-louboutin-heels.us/c-christian-louboutin-peep-toe.html are shaped features. However, you can by no means overlook the beautiful. The christian louboutin 2011 sandals http://www.christian-louboutin-heels.us/c-christian-louboutin-2011-sandals.html You do not even need to go inside environment, as well as your slim, gorgeous and graceful legs may be effortlessly discovered in people's eyes.Welcome to share christian louboutin store! http://www.christian-louboutin-heels.us
The Louboutin 2011 is planned using the ladies. offered the fact that pumps was born, the ladies lifestyle turn into colorful. The christian Louboutin 2011 Pumps
will be the god's masterwork. Who invited the Christian Louboutin Wedges ? Seldom people knew, but I think each and every and every lady will be grateful for him. between the countless pumps,the Christian Louboutin Shoes
could be probably the most exceptional ones. The stylish pattern, the delicate design all mold the ladies perfect leg profile. Flowers inside the spring of 2011 creeping, up from frizzy hair to outfits hold on to footwear, have experienced a brilliant up. on this type of the glamor, spring and summer time flowers now here. Romance is really a woman's mood, exquisite flowers just appropriate of expression within our gestures, the woman, how can we not adore the romantic temperament to make certain which they distributed the flowers do? 2011 flowers bloom will get satisfaction from numerous poses! The Christian Louboutin New Sandalsalso can adds the hright in the ladies, it hold shock toward short lady. especially the red-colored lone in the louboutin heels, beauty and sexy, different ladies are crazy. The red-colored sole, andChristian Louboutin Mensis a very distinctive design, its design reflects its style. You put on it, that means you have its style.the earliest attribute in the Louboutin 2011 stroe.http://www.sale-louboutin-shoes.us
Your blog has some of the most fascinating buy viagra information! I've read several viagra pages here and I just had to comment and let you know that I thought you've been doing a great job here. Keep it up!
Nice post. Its very interesting and meaningful.todd english cookware Best Price
Thank you for sharing to us. There are many people searching about that now they will find enough resources by your post. I would like to join your blog anyway so please continue sharing with us
pizza delivery bag | insulated delivery bags| Delivery bags
Thanks for information cerita seks or you can go at cerita panas Goo info...Or foto bugil
Nice post! Thanks for sharing!
Comprare Viagra
nice to share my love is also wonderful to tell you that Healthy green provides the best Organic vitamins, organic multivitamin for women, herbal remedies and organic supplements.
They use all natural ingredients to create our organic products.
I worked for a call center in the past and this is one of the standards that we had to pass every month-customer satisfaction surveys. Sometimes it is hard because customers will say you didn't do your job well even if you did, when they are mad at the company and the services they have received sucked, that is a little unfair to agents.
phentermine 37.5
This is good site to spent time on .I just stumbled upon your informative blog and wanted to say that I have really enjoyed reading your very well written blog posts. I will be your frequent visitor, that's for sure.
Vancouver Homes for Sale
Hello I am so glad I found your site, I really found you by mistake, while I was researching on Yahoo for something else, Nonetheless I am here now and would just like to say thank you for a remarkable post and a all round thrilling blog (I also love the theme/design), I don’t have time to go through it all at the moment but I have book-marked it and also added in your RSS feeds, so when I have time I will be back to read a great deal more, Please do keep up the superb work.High Blood Pressure Diet &Pakistan Video&Blackhead Remover &Funny sms&EECP
I don’t suppose I have read anything like this before. It is good that there are still people who have some original thoughts on such a subject.
floor cleaning
Hello, this is actually fantastic details. I'd been looking for something equivalent like this. Many thanks for this valuable convenient material.
End of tenancy cleaning | floor cleaning
wow.. its a wonderful information.. thanks for sharing it.
buy codeine online
buy Medicine
Thank you, I have recently been searching for information about this topic for ages and yours is the best I have discovered so far.buy ritalin online
I really prefer Chrome over Firefox. Firefox is being used by a lot of people, but I like Google Chrome better. Thanks a lot
from refinance mortgage
Well, here is the problem with Mozilla, they just can`t improve themselves enough to appeal more people. Chrome is improving every single day.
from Hotel Finder
I was going to comment saying that maps aren't a good indication of language, but everyone else already did that... and I agree for all for all of the reasons listed.
This is a really good read for me, Must admit that you are one of the best bloggers I ever saw.Thanks for posting this informative article.
buy percocet online
I am very much pleased with the contents you have mentioned. I wanted to thank you for this great article. Thanks for posting!
buy vicodin online
I am very much pleased with the contents you have mentioned. I wanted to thank you for this great article. Thanks for posting!
buy vicodin online
I am very much pleased with the contents you have mentioned. I wanted to thank you for this great article. Thanks for posting!
buy vicodin online
Wow! this is a wonderful development. Keep it up...
Renter Screening
Absolutely wonderful post i really appreciate it and i wana read and learn more buy valium online
Ok , Cerita Seks, Cerita Panas, Cewek Bugil, Cewek Indo Bugil, Foto Bugil, Foto SMA, Memek Cewek, Cerita Dewasa, Cerita Terbaru
I don’t know If I said it already, but this so good stuff keep up the good work. cerita panas
Thanks for a nice share you have given to us with such an large collection of information. Great work you have done by sharing them to all. Simply superb
3d ultrasounds | 4d ultrasounds
Hi Buddy, Your blog is really design as clean and superb, I like your post and the information of your blog is very interesting, I really enjoyed it and I also want more information about this, thanks for sharing.
the best seo company
It seems too complicated and very broad for me. I am looking forward for your next post.
cell phone tapping
cell phone spying
cell spy
cell phone spying
Great post! I’m searching for this information for long time and I have found it here.
how to track a cell phone location
how to track a cell phone
Great! Excellent idea really appreciate you Keep it up
find doctor
Something more interesting I got about this blog is that the stuff here is more informative and I was looking for the same kind of article. Thanks :) coban
I’m satisfied by the way you brought out ideas. Thanks for sharing
doctor ratings and reviews
whoaa....really nice information about the content of your post . . thanks for sharing it to us. . really interest me to read a lot..
phone spy software for the safety of my phone.Android phone locator for the tracking of my location.
android gps apps locator and tracking my route.
android tracker also a tracker for my gps.
mobile phone spyware
how to spy on cell phone
free cell phone tapping software
cell phone spy
spy phone software
hello
There are interesting numbers regarding this survey. 87% is a good procent of satisfaction.
vreau sa fac bani
Its very excited for me.. i do like this blog.. thx =
Ngentube ,
Youjizz ,
No HP Tante Girang ,
Tante Girang ,
Togelista ,
RCTI Online ,
Gemscool ,
Point Blank ,
Mivo TV
Thanks.. What youre saying is completely true. I know that everybody must say the same thing, but I just think that you put it in a way that everyone can understand. I also love the images you put in here. They fit so well with what youre trying to say. Im sure youll reach so many people with what youve got to say... Free Sex Story Free Sex Stories
I liked the posts and cool layout you have here! I would like to thank you for sharing your experience and the time it took to post!! Two Thumbs up!
doctor ratings and reviews | find doctor list | doctor reviews by patients | doctor ratings and reviews by patients
experienced your items on Deadly Phrases - such great opinions and a amazing note to enjoy what I use - to be good and variety and use words to make up rather than split down. :)
Classified Ads Andhra Pradesh
ve your blog! Its awesome to go through testimonials of real natural products from someone you can really trust! Also like fumes. I would like for you to assessment the new water groundwork.
Classified Ads Arunachal Pradesh
Nice to be visiting your blog again, it has been months for me. Well this article that I've been waited for so long.
Birthday parties for kids in Miami
Kids birthday parties in Miami
You will be missed.The one place where as a venue and fan I could search by
what ever perimeters I chose .Good Luck with your future endeavors.
http://www.healthygreen.co/
Nice information,Ankara escort
many thanks to the author.Ankara escort
It is incomprehensible to me nowAnkara escort
, but in general,Escort ankara bayan
the usefulness and significance is overwhelming.Ankara escort
Thanks again and good luck!
Ankara escort
became the first designer in Wimbledon's 133-year history to create official uniforms for the tournamentescort ankara
As part of this year's event, which starts next week.
will introduces the first ...Escort ankara
determinationEscort ankara
to maintain and enhance the values for which our two brands are famous throughout the world.Escort ankara
The rugby ralph lauren brand brings to Wimbledon the look of timeless elegance,Escort ankara
drawing on our rich history and traditionsEscort ankara
expert and i like your blog and the information you have
mentioned in this post about the Google tools is really great!
Ankara Escort Bayan
Escort Bayan Ankara
escort bayan
escort
escort istanbul
Bayan Escort
escort bayan ankara
escort bayan ankara
escort ankara ilan
Escort ankara bayan
escort bayan ankara çankaya
Ankara escort bayan
Escort Bayan Ankara
Ankara Escort
Thanks for sharing. Very impressive
I'm still learning from you, but I'm trying to achieve my goals. I certainly enjoy reading all that is posted on your blog.Keep the information coming. I loved it!
buy curcumin
It’s good to see this information in your post, i was looking the same but there was not any proper resource, thanks now i have the link which i was looking for my research.
Classified Ads delhi
testimonial voiceovers
I see the article quiet critical. Thanks for sharing anyways, nice to hear
different opinions on that topic.
testimonial voiceovers
Natural Colon Cleanser
Hi, great Blog. The way you explained it is really awesome and makes everyone to read till the end. Keep posting..
I was very encouraged to find this site. I wanted to thank you for this special read. I definitely savored every little bit of it and I have you bookmarked to check out new stuff you post... Recipe For Chicken Chicken Breast Recipes , Chicken Curry Recipes , Chicken Salad Recipes , Chicken Soup Recipes , Chicken Wing Recipes , Cooking Tips and Trick , Fried Chicken Recipes
You have point out some good point of this query.Pay Someone To Do My Research Paper|Cheap custom research paper
weight loss spray
wow… what a post i like it very much thanks for publishing this article thanks again
enjoyed the posts. lovely
Appetite Control sprayI hope that you never stop and keep posting such valuable content.
naturalsleep aid
Game theory is gives an outstanding idea that is very helpful for all the people on the web.
Curcumin, the major polyphenol found in turmeric, appears to reduce weight gain in mice and suppress the growth of fat tissue in mice and cell models.
buy curcumin
curcumin
These type of content are always motivating and I want to go through quality articles so I pleased to uncover many great point here in the content.
Post Free Classified Ads
Living Food Farm specializes in producing organic Barley Grass Powder for healthy vitamin and mineral supplements.
organic supplements
=|=natural supplements
=|=organic vitamins
Hey there, You have done a fantastic job. I will certainly digg it and personally suggest to my friends. I am confident they'll be benefited from this website.
SEO Company | rumah dijual | perlengkapan bayi | jakarta hotel | party organizer | parfum
the newsroom of the future." It will benefit all the people. appreciate the idea. and Yours truly
Locksmith in brooklyn
::locksmith in nyc
Viagra en ligne
Acheter Viagra France
I know where I'm going and l know the truth, and I don't have to be what you want me to be. I'm free to be what I want.Thankyou i really love it.....
This is the game is played so great. Invite you to experience it interesting things there.
strike force heroes | strike force heroes 4
slither.io | age of war | happy wheels | tank trouble 2
You can receive or send emails to friends and colleagues as well as easy access to the application the Microsoft website. Let's create a separate account for her right now.
hotmail sign in | hotmail login
sign in to gmail | log in to gmail
http://jacresultsnic-2018.in/ The AP intermediated exams ware established in 1971 and it is located at Nampally Hyderabad
Do you think to make your surveys on instagram? You can buy instagram followers and try it.
Do you need an urgent loan of any kind? Loans to liquidate debts or need to loan to improve your business have you been rejected by any other banks and financial institutions? Do you need a loan or a mortgage? This is the place to look, we are here to solve all your financial problems. We borrow money for the public. Need financial help with a bad credit in need of money. To pay for a commercial investment at a reasonable rate of 3%, let me use this method to inform you that we are providing reliable and helpful assistance and we will be ready to lend you. Contact us today by email: daveloganloanfirm@gmail.com Call/Text: +1(501)800-0690 And whatsapp: +1 (501) 214‑1395
NEED A LOAN?
Ask Me.
Get Packers and Movers Bhopal List of Top Reliable, 100% Affordable, Verified and Secured Service Provider. Get Free ###Packers and Movers Bhopal Price Quotation instantly and Save Cost and Time. ???Packers and Movers Bhopal Reviews and Compare Charges for household Shifting, Home/Office Relocation, ***Car Transportation, Pet Relocation, Bike SHifting. Packers And Movers Bhopal
xpolet
website
jinggara
Post a Comment